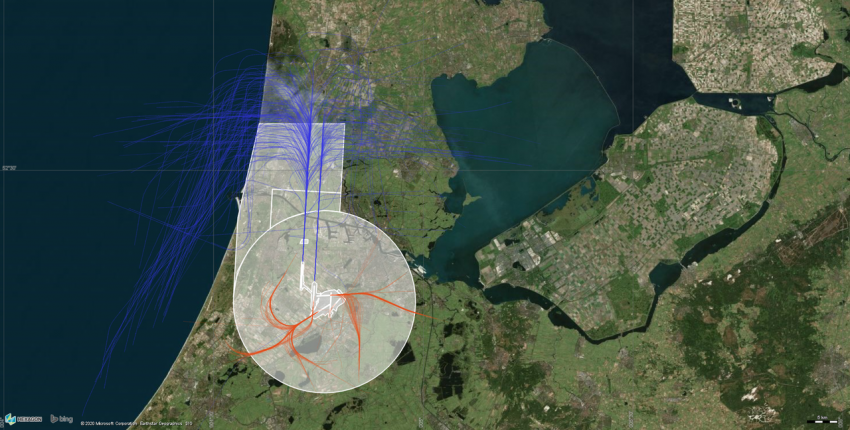
Presenting 3D geographical data in a 2D report in a way that is intuitive for multiple audiences is challenging. Important characteristics get lost in a flat representation. Airspace is typically structured in complex 3D shapes and flight tracking is incomplete without information on altitudes. To understand the (re)design of an airspace, we need to see airspace structures and flight tracks from multiple perspectives.
[blockquote text=”3D visualisations can support communities in understanding airspace and route limitations.” text_color=”#004361″ show_quote_icon=”yes”][vc_separator type=’transparent’ position=’center’ color=” thickness=’5′ up=” down=”]
2D prone to misinterpretation
The structure of an airspace and the flight tracks within it are indisputably three-dimensional. A flat, 2D representation makes the information presented prone to misinterpretation, especially if the reader is unfamiliar with how to translate the 2D picture to a real-life situation. Even experts can struggle to correctly interpret the complex 3D shapes when looking at a 2D output of how an airspace is structured.
In addition, recognising vertical flight separation is harder when tracks are flattened to a 2D image. This makes it difficult to differentiate when many flows merge or intersect. The added time-dependency of flight tracks adds another layer of complexity.
The crucial third dimension
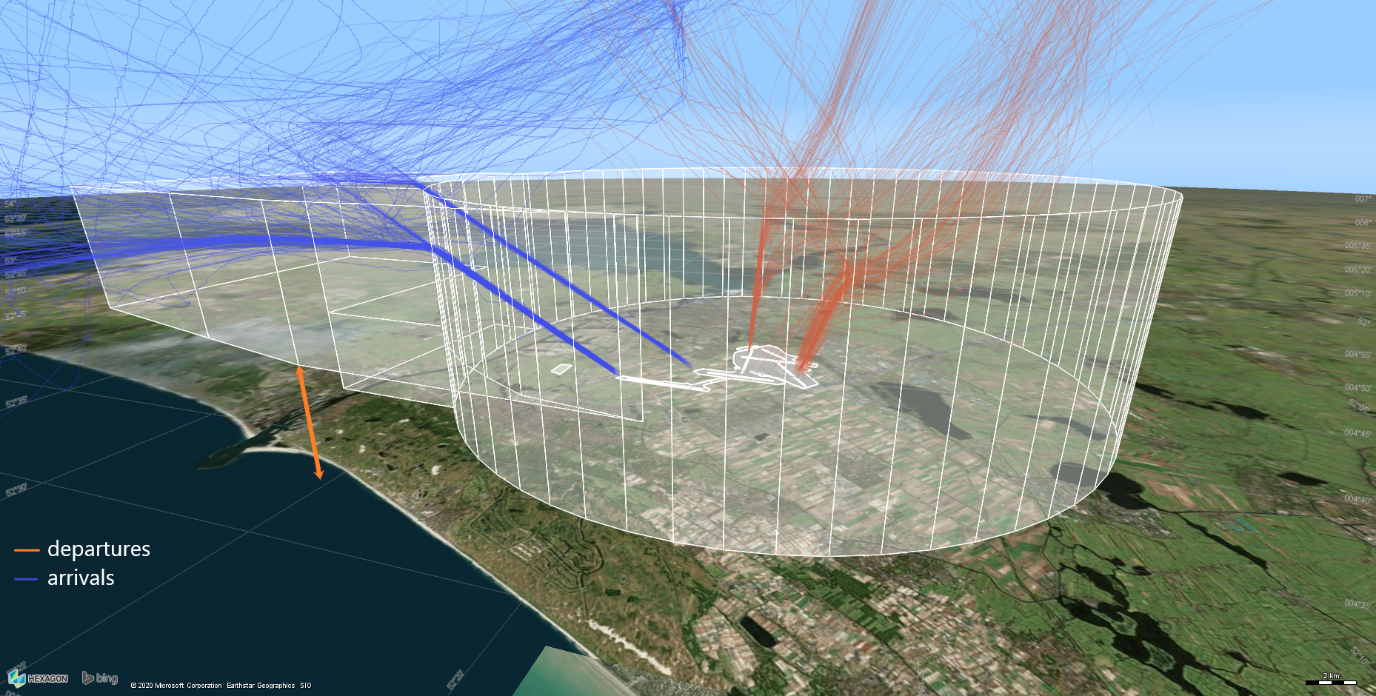
One difficulty in visualising airspace structures in 2D is the existence of “balconies,” or areas where structures overlap laterally and the space below (and sometimes above) the structure is not restricted or controlled. This is visible in the example below of the structured airspace around an airport.
The L-shaped structure on the left does not start from ground level, but rather at 365m/1200ft height. Drones can fly there, for example, and small aircraft may be allowed to fly there without direct air traffic control. Note that altitude exaggeration has been applied here to show the vertical differences more clearly.
Understanding flight tracks is also limited by representations in 2D. In publications, they are often plotted as lines on a map. Altitude dispersions and frequency of altitudes cannot be shown, despite their significant influence on overflight noise. Similarly, noise contours usually show only the annual averages of noise simulations, but to fully understand them, you need to differentiate frequency, altitude and flight types. Such factors could be clearly seen if presented in an interactive 3D visualisation.
Versatility of 3D visualisation
Multiple dimensionality is critical to visualising and understanding airspace structures and flight tracks. We developed our own 3D track visualisation software, built upon Hexagon Geospatial’s LuciadLightspeed framework, to allow us to explore and examine airspaces from every perspective. With it, we can load and interactively filter any type of spatial data, including ADS-B tracks, to create airspace visualisations. We can then experiment with changes and adjustments such as altitude exaggeration and turning specific structures on and off and analyse their effects.
This versatility of a 3D visualisation tool means it can be used for drafting new airspace structures to test airspace redesign. The ease of adjusting structures helps to ‘optioneer’ different variants. It is also useful for quickly analysing overflight characteristics for specific neighbourhoods (down to individual addresses) and to help explain the principles of vertical separation in public noise information sessions.
The visualisations can support communities in understanding airspace and route limitations. They can give insights into how wind turbines and aviation interrelate or explain the design process of routes to the various stakeholders, just to name a few possibilities. Whether demonstrated live or used in a video, 3D is an excellent way to represent airspace and flight tracks more intuitively.
About To70. To70 is one of the world’s leading aviation consultancies, founded in the Netherlands with offices in Europe, Australia, Asia, and Latin America. To70 believes that society’s growing demand for transport and mobility can be met in a safe, efficient, environmentally friendly and economically viable manner. To achieve this, policy and business decisions have to be based on objective information. With our diverse team of specialists and generalists to70 provides pragmatic solutions and expert advice, based on high-quality data-driven analyses. For more information, please refer to www.to70.com.


